آخرین خبرها
حساب دیسکورد ایپ کوین هک و 360,000 دلار NFT به سرقت رفت
15 خرداد 1401شبکه سولانا برای ساعاتی متوقف شد!
12 خرداد 1401میرور پروتکل، مجددا هک شد
10 خرداد 1401رئیس بانک مرکزی: رمزریال تا شهریور عملیاتی می شود.
10 خرداد 1401فروش جایزه یورو ویژن 2022 به ارزش 500 اتریوم
10 خرداد 1401آیا ریزش قیمت لونا 2 در راه است؟
9 خرداد 1401رصد حساب های بانکی جهت مبارزه با پولشویی
8 خرداد 1401ارز دیجیتال ملی آمریکا ممکن است 5 سال طول بکشد
8 خرداد 1401آخرین نوشته ها
الگوی سه حمله (Three Drives Harmonic Pattern) چیست؟
6 مرداد 1401الگوی سایفر (Cypher Harmonic Pattern) چیست؟
6 مرداد 1401الگوی کوسه (Shark Harmonic Pattern) چیست؟
6 مرداد 1401الگوی پروانه (Butterfly Harmonic Pattern) چیست؟
5 مرداد 1401الگوی هارمونیک خرچنگ (Crab Harmonic Pattern) چیست؟
5 مرداد 1401الگوی هارمونیک خفاش (Bat Harmonic Pattern) چیست؟
5 مرداد 1401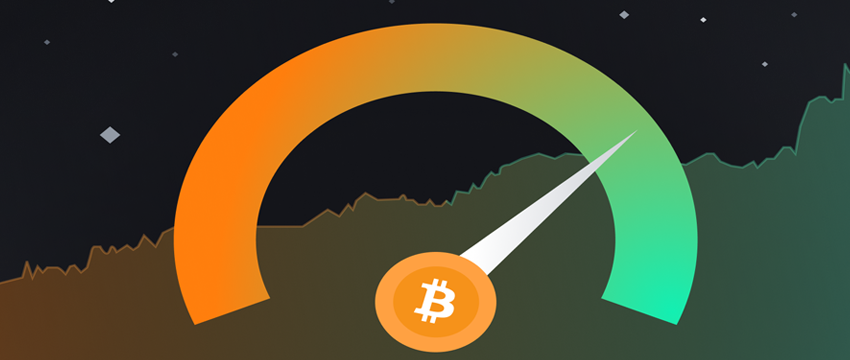
شاخص ترس و طمع (Fear and Greed Index) در ارز دیجیتال چیست؟
If you are familiar with the digital currency market, you must have heard the name of fear and greed index. Especially during the collapse of the digital currency market, the name of Fear and Greed index is mentioned everywhere. In this article, we want to know more about this index and how to calculate it, so I suggest you stay with us.
What is the Fear and Greed Index?
The fear and greed index expresses the general public’s sentiments towards the digital currency market and is actually an indicator that analyzes the sentiments of market participants. This index is currently only calculated for Bitcoin. But the development team of this index will also calculate the fear and greed index for altcoins in the future.
In fact, this index shows the fear and greed of people in the digital currency market numerically between zero and one hundred. This period is divided into 5 sections, which we explain each of these sections below.
Range 0 to 25 : The range of absolute fear is Extreme Fear, in this range, people are not optimistic about the future of the market, and there is a lot of fear in the digital currency market, and Bitcoin is traded below its intrinsic value.
Range 25 to 50 : It indicates Fear, that in this range, people with short-term or medium-term trading strategies are afraid in the market, and the market outlook is bearish in the medium term.
Range 50 : Neutral range, in this range, Bitcoin trades near its intrinsic value and the market moves logically.
Range 50 to 75 : represents Greed, in this range, people are willing to pay higher prices for purchases due to the prevailing sense of greed in the digital currency market.
Range 75 to 100 : The range of absolute greed is Extreme Greed, in this range, most newbies are willing to pay very high prices for Bitcoin due to the fear of losing profits, and this means that the general public is feeling very optimistic about the price growth. It is Bitcoin.
To view this index, you can use the alternative site .
How is the fear and greed index obtained?
This index is obtained from 5 data, which are: 25% digital currency market fluctuations, 25% buying and selling volume, 15% observation of people’s feelings in the media, large surveys and sentiment detection. General public at 15% (this section is currently inactive, but has been used before), Bitcoin Dominance at 10%, Trend and Search Volume at 10%, which will be explained in more detail below. We will pay these items.
Fluctuations in the digital currency market
In the fear and greed index, daily fluctuations are compared with the average fluctuations of the last 30 and 90 days. In case of strong upward fluctuations, this index shows a larger number, and in case of strong downward fluctuations, this index shows a smaller number.
Volume of buying and selling
To calculate the fear and greed index, the volume of daily buying and selling in the market is compared with the average of the last 30 and 90 days. If the volume increases, this index will show a higher number (more greed) and if it decreases, it will show a lower number (more fear).
Monitoring the media
By monitoring Bitcoin-related hashtags on social networks such as Twitter and Reddit, you can understand the general sentiments of people. If people’s hopes increase in social networks, a larger number is attributed to the fear and greed index. By reducing these positive feelings and even writings that contain the message of fear and concern in this field, the index of fear and greed will see a lower number.
Survey
This section is currently not used in calculations. In the past, it has been used to determine the index number with large surveys of people’s expectations regarding the future of Bitcoin. If, in these polls, the general public sees the trend of Bitcoin in the upward direction in the future, this index will show greed and vice versa.
Bitcoin Dominance
Bitcoin dominance in general means how much of the capital in the digital currency market is invested in Bitcoin? If you want to know about how money circulates in the digital currency market and how much Bitcoin dominates, we suggest you read What is Bitcoin Dominance?
A part of Bitcoin Fear and Greed Index is calculated from Bitcoin Dominance. If Bitcoin’s dominance decreases, the Bitcoin Fear and Greed Index will show more fear. Because it shows that the general public is not interested in investing in Bitcoin. If Bitcoin Dominance increases, the Bitcoin Fear and Greed Index will show more greed. Because it shows that the general public considers the Bitcoin trend to be bullish.
Trend and search volume
To calculate this index, in addition to the mentioned cases, tools for checking the trend and amount of search, such as Google Trend, are used. During the bull trend of the Bitcoin market, the amount of searches on how to buy Bitcoins increases. At the time of the market crash, this amount of search will decrease significantly.
How to use the fear and greed indicator in trading
There is a very famous quote from the successful American investor Warren Buffett who says:
“Fear when all covet, and covet when all fear”
Of course, this word alone should not be the principles of your trading, but you can get better results by combining this word and your trading method. For example, with your analytical methods, you get a range for the end of the Bitcoin correction. Now, if the fear and greed index shows absolute fear in the market in this range, we can hope for the return of Bitcoin price. And if with your analysis you have noticed that the price of Bitcoin has reached a strong resistance and the fear and greed index also shows absolute greed, we can expect price correction from Bitcoin.
Conclusion
In this article, we tried to explain the important points of using the fear and greed index. But you should note that this index, like all other analytical tools, is only a means of predicting the future. All these tools, like any other mathematical calculation, may be subject to error. You should never rely on just one tool for buying and selling, and these tools are only an auxiliary tool for better conclusions.
برچسب های مقاله: شاخص ترس و طمع
نظرات کاربران
دیگر مطالب مرتبط

الگوی سه حمله (Three Drives Harmonic Pattern) چیست؟
الگوی سه حمله در دسته الگوهای پرتکرار بازگشتی قرار می گیرد. نام دیگر این الگوی هارمونیک سه یورش می باشد. ساختار الگوی هارمونیک سه حمله […]

الگوی هارمونیک پنج صفر (0 – 5 Harmonic Pattern) چیست؟
الگوی 0 – 5، در سال 2007 توسط اسکات کارنی (Scott Carney) در جلد دوم کتاب معاملات الگوهای هارمونیک (Harmonic Trading) معرفی گردید. الگوی هارمونیک […]